How to draw an ellipse in Pandas Pie?
How to draw an ellipse in Pandas Pie?
Pandas provides the method DataFrame.plot.pie() or Series.plot.pie() for drawing pie charts.
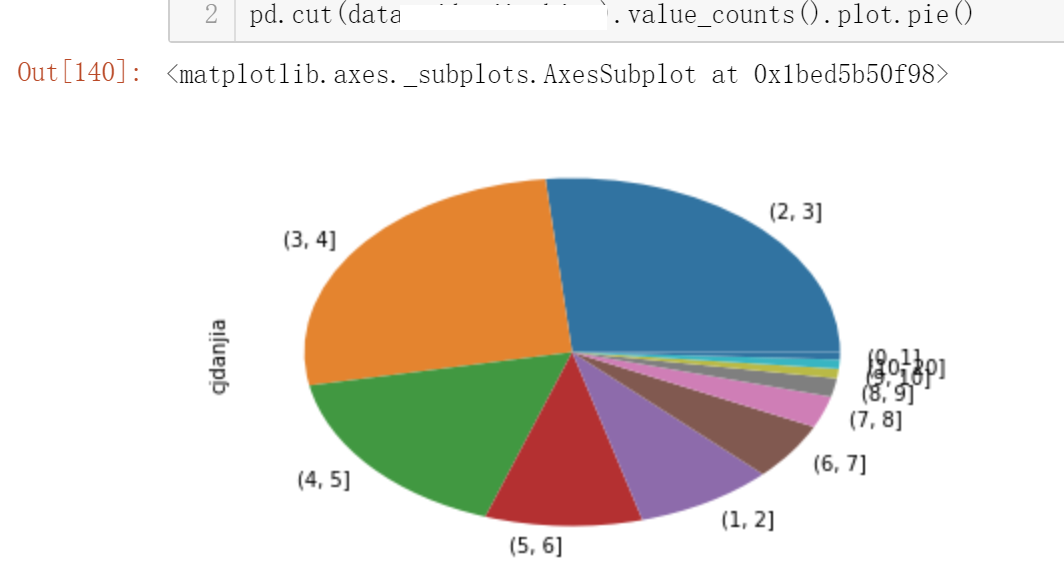
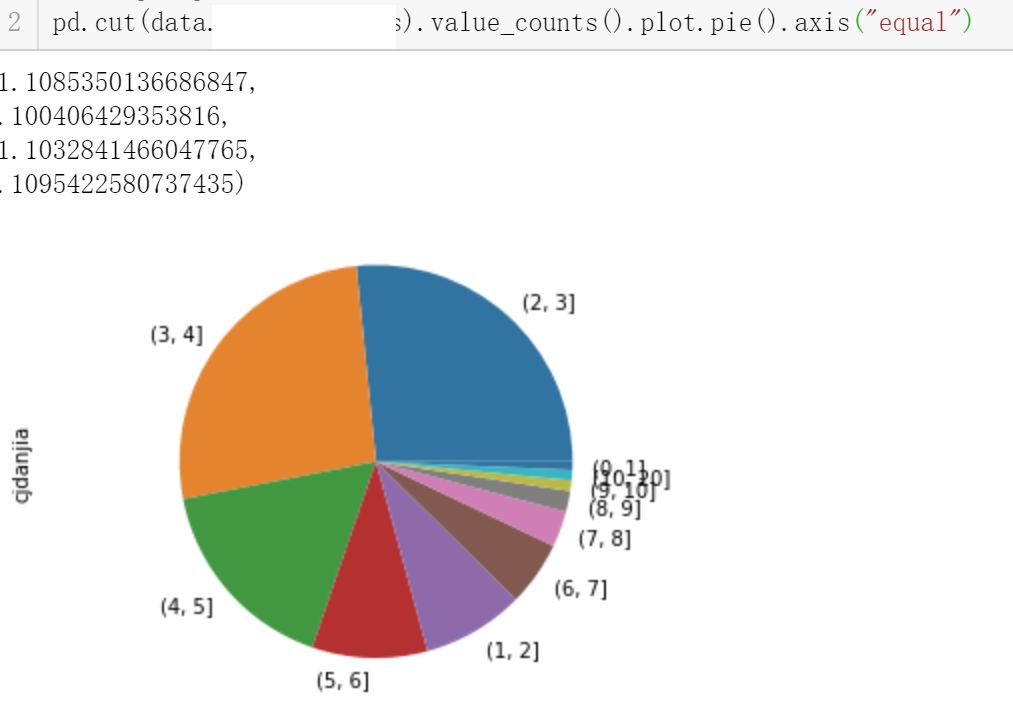
But I discovered something interesting: in some versions of Pandas, the pie chart displays an elliptical chart, while my current version of the pie chart displays a perfect circle chart.
I opened the Internet and found that in some versions Pie does draw ellipses, and you can draw a perfect circle through plot.pie().axis("equal").
How to draw an ellipse or customize an ellipse?
In Pandas source code you can find that its drawing is implemented through matplotlib of.
def pie(self, **kwds):
"""
Pie chart
.. versionadded:: 0.17.0
Parameters
----------
**kwds : optional
Keyword arguments to pass on to :py:meth:`pandas.Series.plot`.
Returns
-------
axes : matplotlib.AxesSubplot or np.array of them
"""
return self(kind="pie", **kwds)
So how does matplotlib draw a pie chart?
From the official documentation:matplotlib.pyplot.pie:https://matplotlib.org/api/_as_gen/matplotlib.pyplot.pie.html?highlight=pie#matplotlib.pyplot.pie
which mentioned
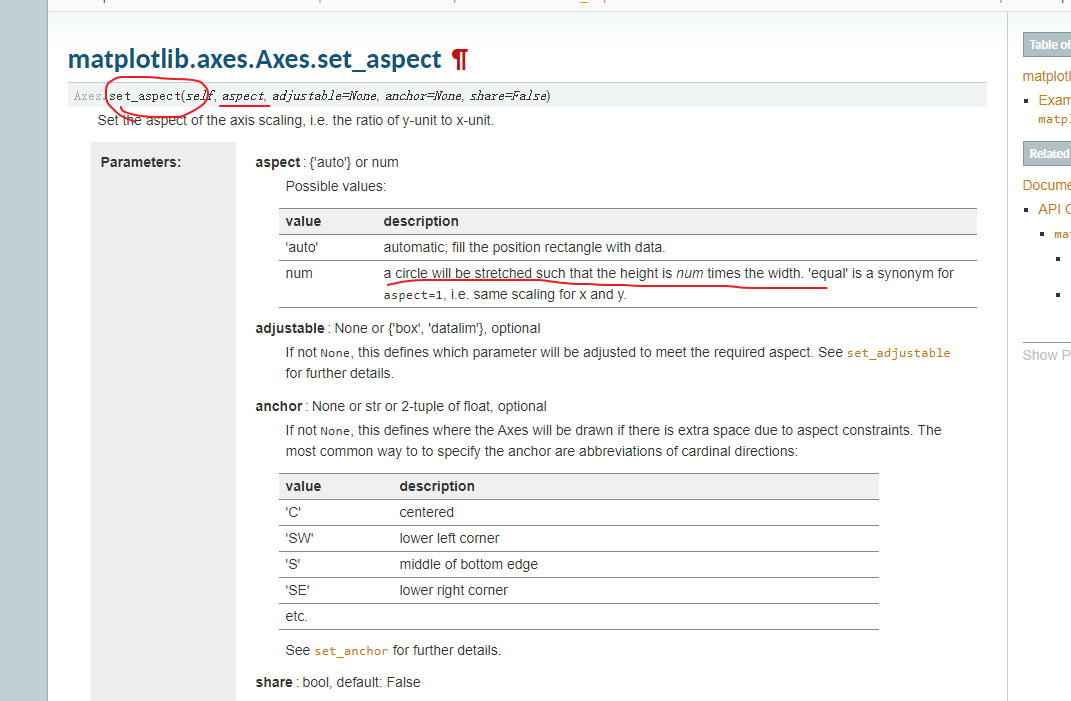
The axes aspect ratio can be controlled with Axes.set_aspect.
So find the setting method inmatplotlib.axes.Axes.set_aspect:
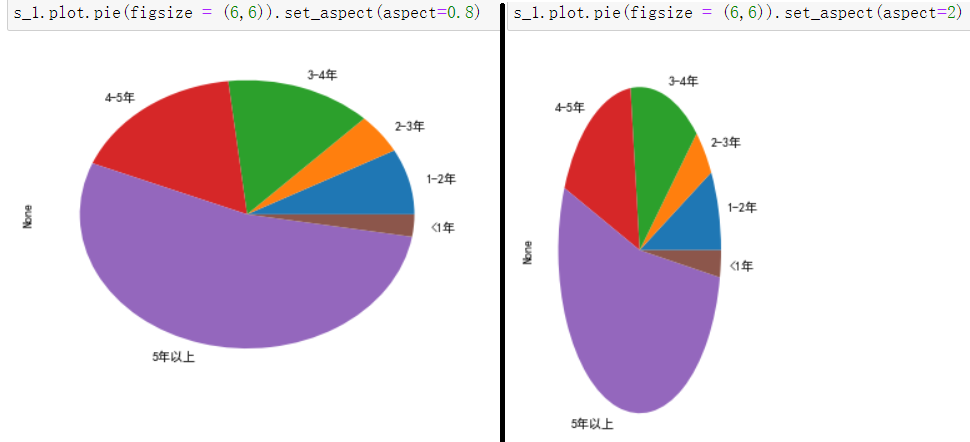
You can customize the ellipse by modifying the aspect ratio of the circle n times inpie().set_aspect(aspect=n).
Finally I can draw ovals happily!


